One of the most important keys to success on Amazon is knowing what data to pay attention to and how to make sense of it.
As a seller, two of the most important pieces of data you can use for sourcing decisions are an item’s sales rank and the price it sells for. You probably already know how to use the Amazon Seller App to get the current sales rank and price – but the current data is only a small piece of the puzzle.
That’s where Keepa comes into play.
While Keepa can do many things, the main thing it is known for – and the main thing we use it for in our business – is sales rank and price HISTORY charts. As I’ll explain below, this is often even more important than current data.
If this is not the tool you were looking for, check out this list of the essential tools we use in my 7-figure online selling business. If you are new to selling on Amazon, this beginners guide is a better place to start.
Here’s everything we’ll cover in this post:
- What is Keepa?
- What information does Keepa provide?
- Why is the information that Keepa offers important?
- Using Keepa’s Google Chrome extension
- Using Keepa’s website
- How much does Keepa cost?
- Set up Keepa
What is Keepa?
Keepa is a tool that is best known for tracking the history of every Amazon item’s price and sales rank.
Using their Chrome extension, you can have this information automatically load on the product page for every item you view on Amazon. The information loads just below the product photos area on a listing page. See the below screenshot for reference:
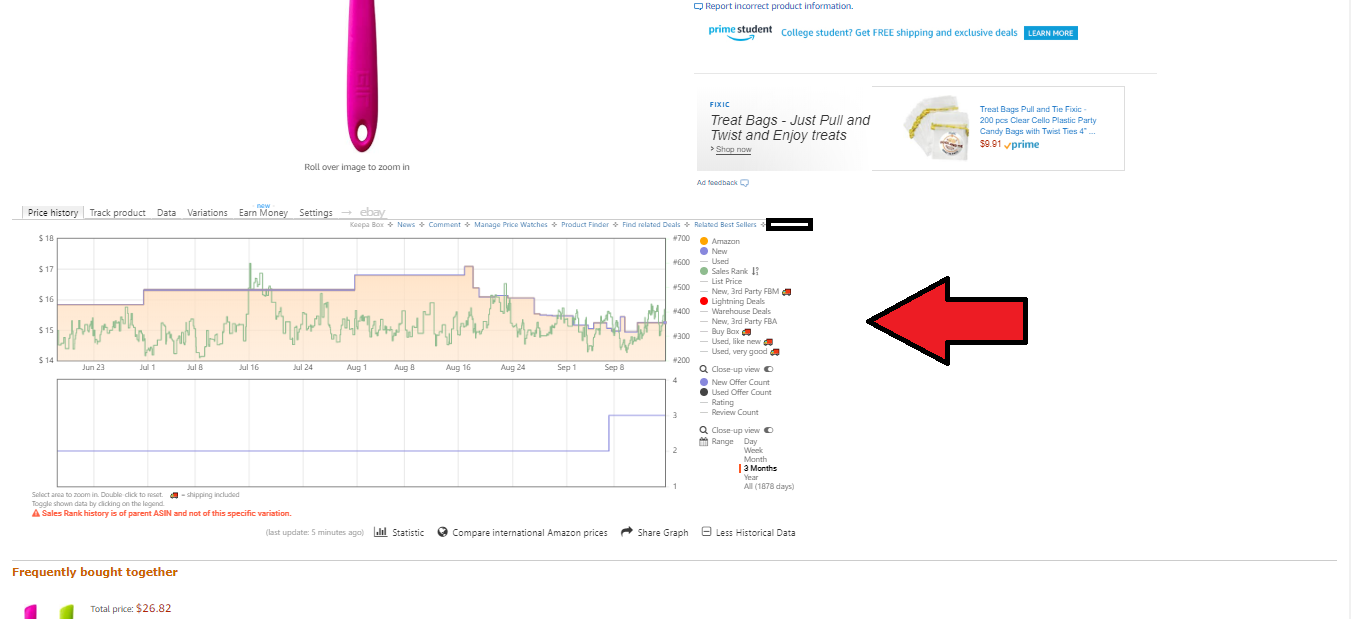
On top of Keepa’s sales rank and price history charts, their website provides additional tools for product research, discovery and evaluation. You can also search for the top products or seller storefronts by category as they have the ability to supply this information because they collect data from a user every time they view a product.
This has helped to create one of the most extensive lists of products and sellers in the Amazon space. Due to this extra component, it’s better to think of Keepa as a data company that provides insights beyond displaying pricing charts.
What information does Keepa provide?
Keepa provides data on an Amazon item’s sales rank, price history, new offer price, used offer price, Amazon offer price, and total number of offers, as well as information on top-selling products and top-ranked sellers.
The list goes on and on, and your ability to navigate this software can dramatically increase your chances of finding good quality products that will sell quickly and for your expected ROI’s.
Even though we are going to walk through many of the uses for this software in this guide, keep in mind that this is not a complete list. I recommend taking the better part of a day and really deep diving into this software both on product detail pages with the extension and with the lists on the Keepa website so that you know how to navigate the data efficiently and can call upon it when you need to evaluate products in the future.
Why is the information that Keepa offers important?
The short answer is that an item’s current sales rank and price only tells a very small piece of the story.
While the current sales rank and price MAY accurately reflect the normal selling conditions of an item, there are many things that can make current data a poor reflection of future selling conditions. These include:
- Seasonality
- A temporary lack of supply
- A temporary supply surplus
- Changes in supply to competing products
- High demand in Q4
- Current events
These are just a few of the things that we’ve seen cause a short-term change to sales rank and price. Whatever is causing it, having access to the historical data gives you a better idea of what to expect in the future.
Using Keepa’s Google Chrome Extension
Now that you have an idea of why this information can be important, you can use Keepa’s Google Chrome extension to:
- Determine average sales ranks
- Evaluate price history and stability
- Update the prices on products you have listed for sale
- Determine your risk profile in regards to the number of other offers on the listings
Determining Sales Ranks
One of the most important features of Keepa is the sales rank history they provide via the Google Chrome extension. Here is a guide to using sales rank data.
Below is a close up of a sample chart that would load on all of the product detail pages you would visit.
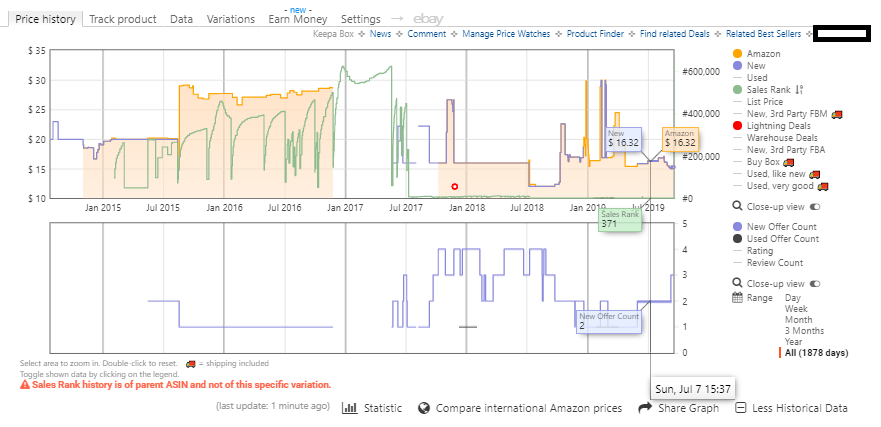
The green line in the graph above is the sales rank for this product represented by the parent ASIN over the given time period. In this example, we have the sales rank numbers on the chart to the right of the graph from 0 to 600,000 in increments of 200,000 for each line.
You can also see where it says “Sales Rank 371” on the right hand side. This has been generated by hovering over the graph at that point to get the data for a particular day.
As you can see, the sales ranking can vary a lot over time – especially when looking at a period of years. In this graph, it almost appears as if it’s on the bottom line of the chart from July 2017 through July 2019. This is due to the fact that the ranking has been much lower in the last couple of years than it was in the past.
To make the changes in the recent past easier to see, you can easily switch the timeline on the bottom right-hand corner to “3 Months” to get a more recent snapshot. When we evaluate product we want to see how the sales rank has behaved across many time periods, with more emphasis put on recent days, weeks, and months. It is important to toggle the time period to factor into your sourcing decisions.
We look for products that tend to have sales ranks that get better or are consistent over time so that they sell through more product. We don’t tend to get excited about increasing sales ranks over time – the one exception is when the sales rank is getting worse because the product is out of stock.
Price History and Stability
Take a look at the chart again:
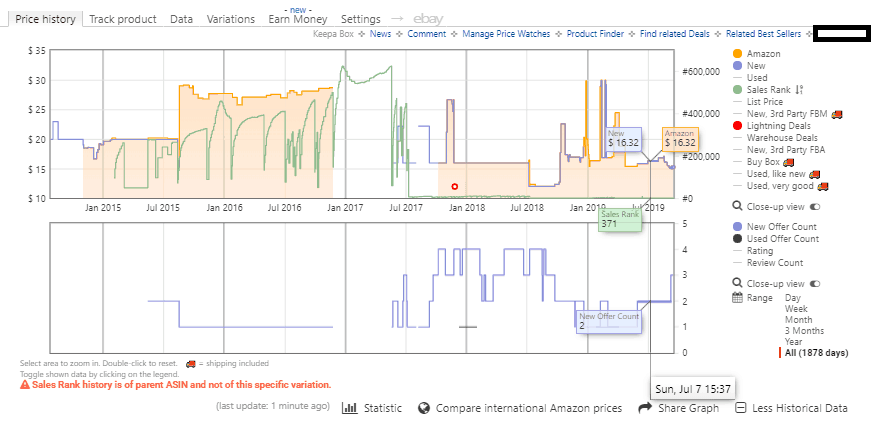
The blue line represents the new price of a product sold by a 3rd party seller without shipping.
The orange line above represents Amazon’s (as a seller) new price. Furthermore the orange shading on the top graph below the orange line represents when Amazon is in stock. When there is no shading this represents Amazon being out of stock and when there is no orange or blue line present this would indicate all offers are out of stock.
Unlike the sales rank metric, these lines represent the pricing on a variation (if selected), but the sales rank will still be relevant to the parent ASIN only. So you want to change the variation to view the correct pricing for each color or size if you’re on a listing that needs it.
We tend to focus on the average price over time and how this changes due to Amazon being in and out of stock. It’s also important to understand how the number of offers or sellers can impact the stability of the pricing over time.
Number of Offers
Reference the chart one more time, this time to view the blue line below the pricing chart component to view the new offer count.
This represents how many sellers are on the listing at any given time and allows you to easily reference the pricing chart directly above to see the corresponding changes in price.
This is powerful information because it helps you understand the competition for this product and how aggressively the competition may be pricing the product when numerous other sellers are on the same listing.
This metric is also an easy way to evaluate when a product is or has been out of stock when the offer count goes to zero or the line is non-existent. Keep in mind that the offer count, just like the pricing part of the top graph, is relevant to the selected variation or the child ASIN.
We use this to see what the selling environment looks like and how aggressively we may have to compete when trying to liquidate product. This also allows us to make some assumptions on pricing stability combined with how consistent the pricing is over time with an influx of sellers.
Current Pricing
Using all of this information above we can evaluate where the current price is in relation to the data and how it may perform over time. For example, is it worth slashing a price or holding steady based on past performance?
We can better answer this question with the data in the chart. If prices tend to rise when other sellers run out of stock and we’re looking at a seasonal product, then this could be an item we would want to maintain a high asking price on and wait for the price to rebound.
In another example, we could also examine a pricing graph and realize an item may be priced way too high compared to the past when the sales rank was better. Assuming the ROI still makes sense, decreasing the price could be a change that we would want to make in hopes of increasing our sales – knowing that it would most likely sell for a lower price anyways.
These are some of the discussions we have internally when optimizing pricing and using the charts to our advantage.
Research via Keepa’s Website (Product Discovery, New Categories, Other Sellers)
Above we covered the Google Chrome extension pricing charts. In this section, we are going to cover how to use Keepa’s website to research products, categories and sellers.
This is a good way to find products to source and what other successful sellers are moving on a daily basis.
Product Discovery
To use this feature, navigate to the “Data” section and select the “Best Seller Lists”. This will bring you to a page where you can view the best selling products in any category of your choosing.
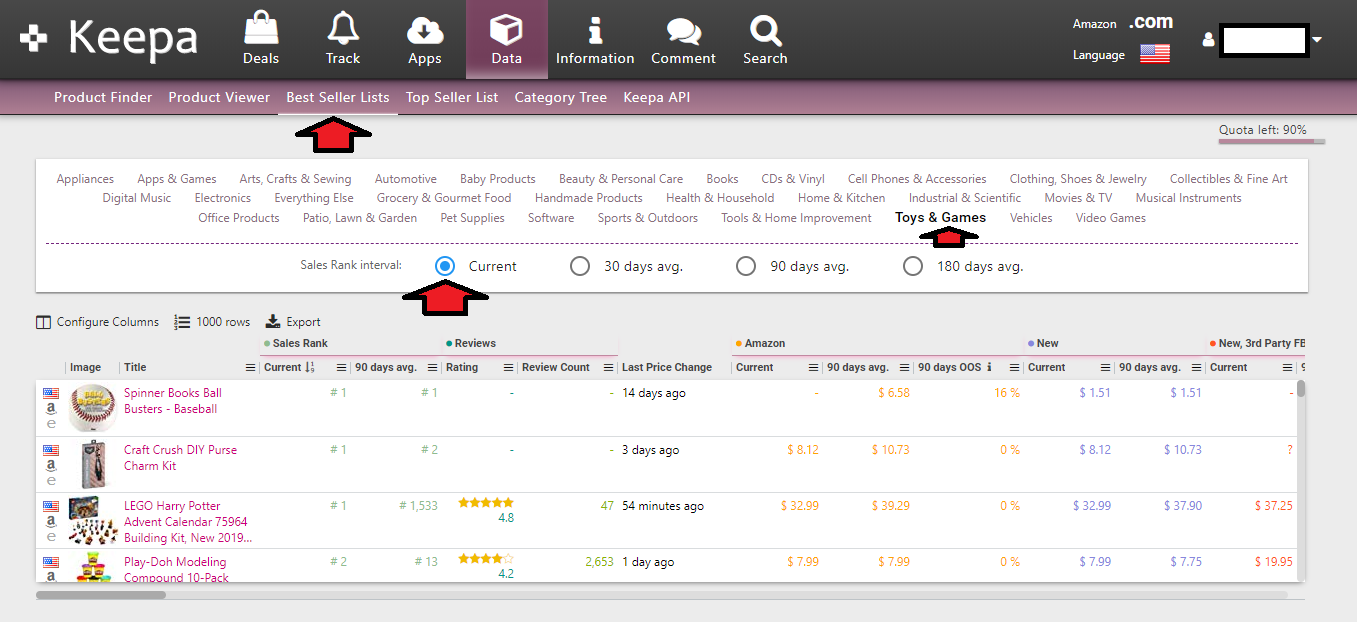
For this example, I selected “Toys & Games” and “Current” sales ranks to give me the most up to date information. Then you can simply scroll through the best selling products in that category!
Searching for Products in New Categories
In this section, you will again navigate to “Data” and then select “Product Finder”. From there you will be able to choose any number of selections to populate products that falls under your guidelines.
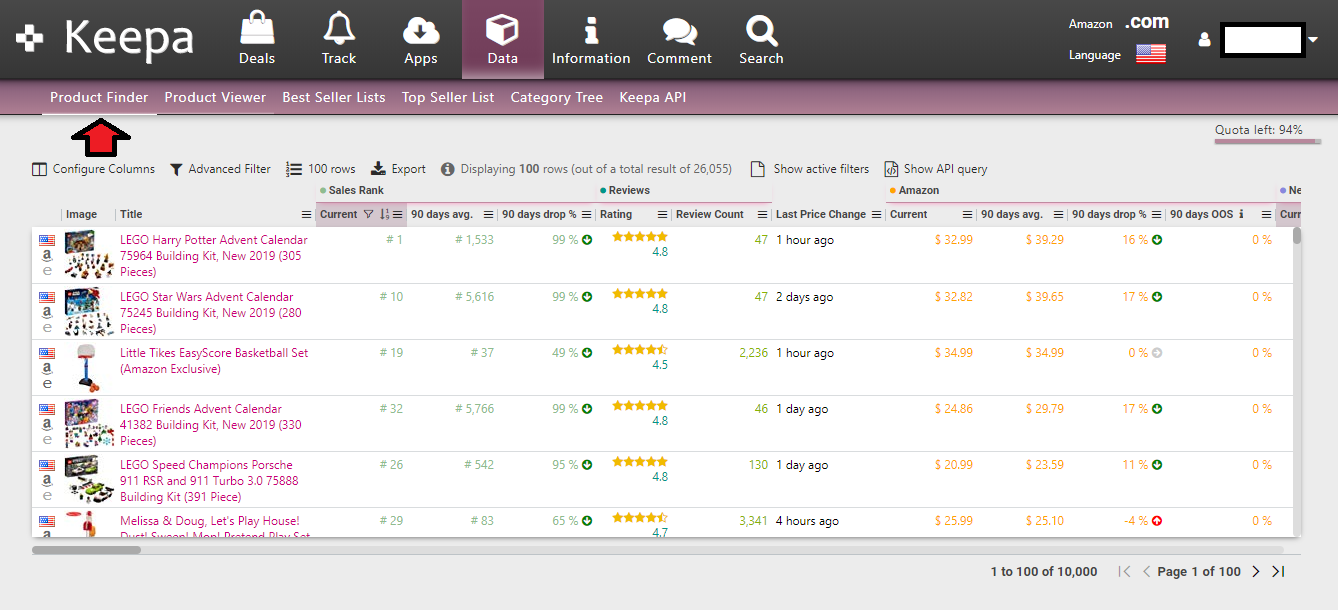
For this example, I just chose three items, but there are literally hundreds of ways to search for new products using this method. I chose to search for products from 0 – 100,000 sales rank with a new price between $20-$50 and in the category of “Toys & Games”.
Using these filters allows you to really narrow down your search to new products or products related to the ones you’re already selling. This can help you identify new suppliers for wholesale, opportunities for retail arbitrage, or online arbitrage, or ideas for private label sourcing.
Identifying Other Top Sellers
In this example, you will want to navigate to “Data” and then click on “Top Seller List”. This will bring you to the following screenshot below where you can view the top sellers on Amazon in terms of total number of reviews. This assumes the more reviews you have, the more product you sell. This isn’t a perfect system, but it can get you fairly close.
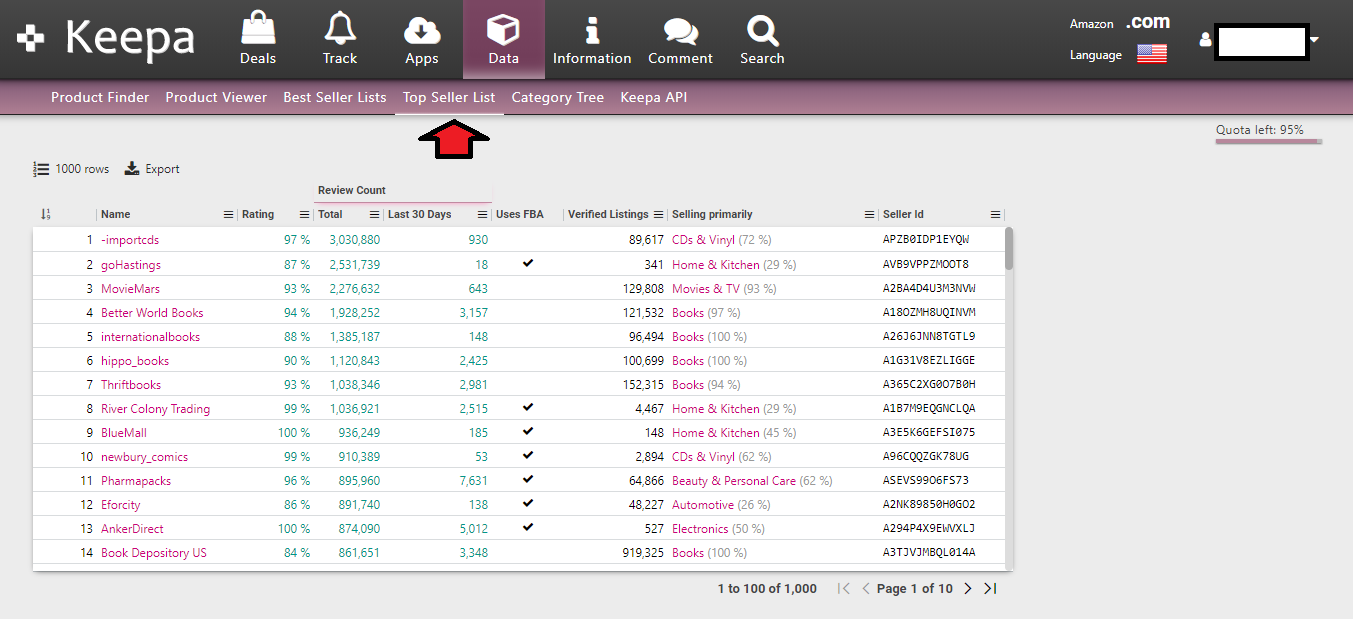
One of the biggest features is that you can sort sellers by category if you desire. If you sell a certain type of product, this can help you find storefronts that you want to emulate.
You can view the storefronts you want by clicking on the names of the sellers, and this can help you identify new opportunities and possible paths for you to expand your business. This can be very helpful for new sellers.
Additional Tips
One of the last things I wanted to showcase with Keepa is the “Category Tree” section, which is located under the “Data” portion of the Keepa website.
If you click on the drop downs next to the category names you can view their sub categories as well. Again, this may not be perfect information, but moves you closer to basing decisions off of data points which is a good move to make if you weren’t already or simply relying on other peoples information.
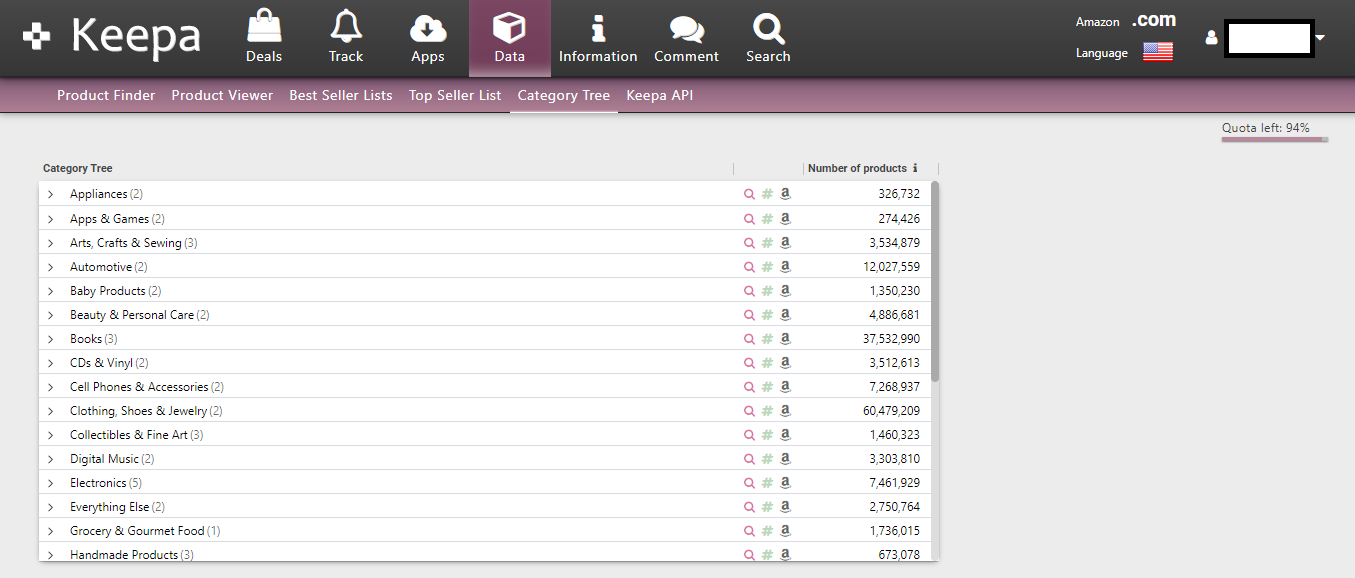
This section allows you to see the number of products within each category. This helps you understand what the ranking would mean in respect to how many products are in the category you are researching.
This can be very informative because a 100,000 ranked product in “Appliances” is much different than a 100,000 ranked product in “Books”.
A product with a sales rank of 100,000 in Appliances falls outside the top 30% of products in the category (100,000 divided by 326,732 is 30.6%).
In Books, a sales rank of 100,000 is in the top 1%!
Who’s This Tool Built For?
This tool is built for all sellers. From beginners who are selling their very first product to experienced sellers who are selling hundreds of thousands of dollars per month. It simply is the best price and sales rank software out there and it is essential that your data is the best it can be when you are spending money based on those values.
It’s also best for all styles or various sourcing methods for Amazon businesses. This tool can be used for retail arbitrage, online arbitrage, wholesale and private label. It assists every facet of those models from sourcing to selling and is something every seller should have access to so that they can make better informed decisions.
How much does Keepa cost?
Keepa costs 15 € per month, which is a little less than $17 per month as of October 2019. This is for their premium plan with all of their features. They do have a free plan that provides certain info, but doesn’t cover everything we talked about in this post. And we aren’t getting paid to say this, there aren’t any affiliate links for Keepa in this post, we’re just sharing some of the details on a tool we believe can help you in your business.
This is a very inexpensive tool for your business when you consider the data it gives you access to. You should have no trouble getting a positive ROI on this investment, as it gives you access to data that ensures your buying, pricing and research decisions are the best they can be.
Although this product was completely free up until early 2019, you shouldn’t even think about looking for a substitute product or a way to do the same research without paying for the subscription. The cost to not use the software is too great!
How To Set Up Keepa
To set up Keepa, you will want to head to Keepa’s website and create an account by registering as shown below:
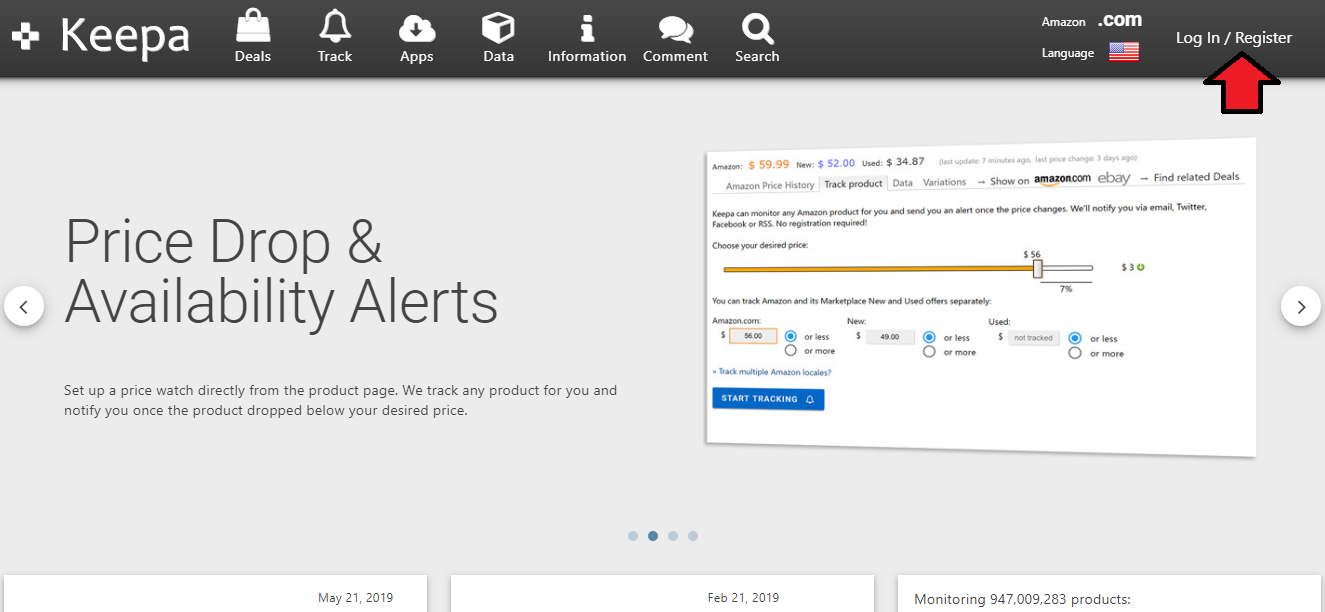
Their website can be a little confusing to use at first, but don’t let that stop you from getting your account set up.
Once you register, you’ll need to verify your email address and then “turn on” the subscription toggle that you can find by clicking subscriptions within the account drop-down menu in the top right.
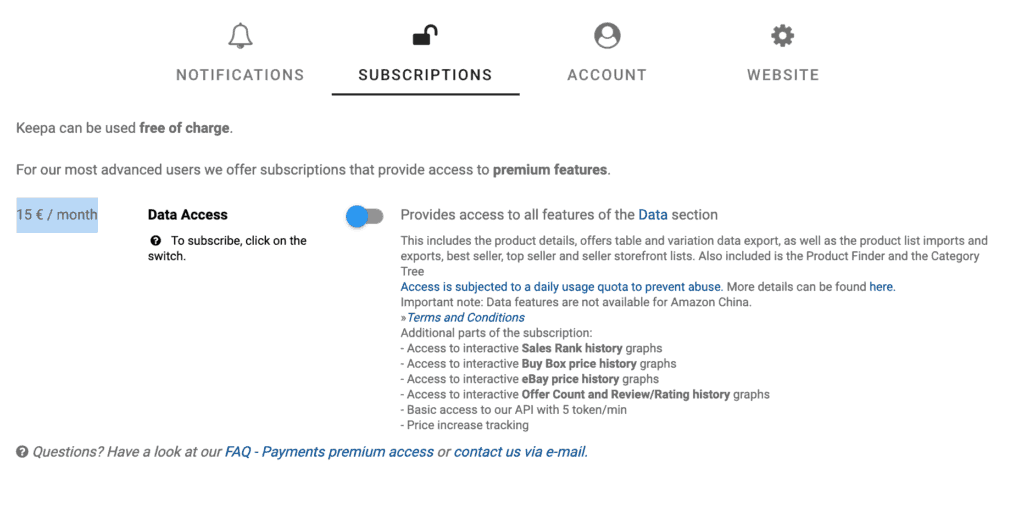
You’ll also need to enter your payment details to complete the subscription.
Keep in mind they do have a free version, but many of the core features we described in this post will not be included unless you have the paid version – or your access to them will at least be significantly limited.
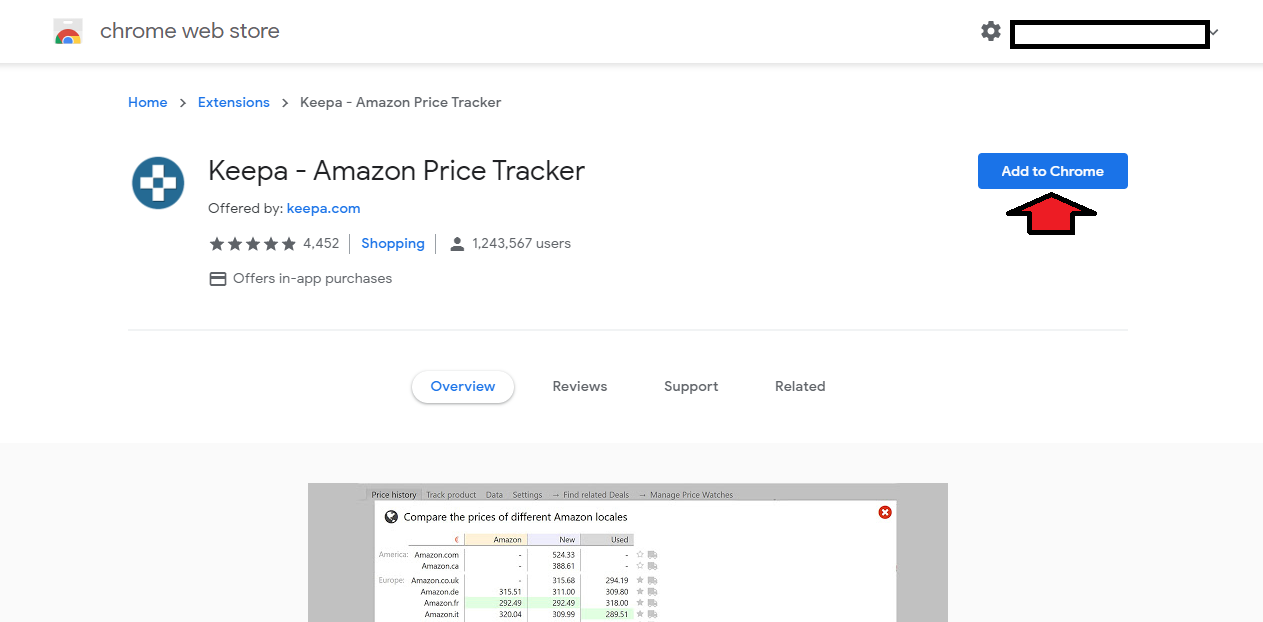
Downloading the Keepa Chrome Extension
Now that the account on Keepa’s website is fully completed, you will head over to the Google Chrome store and download the Keepa extension. This will provide the pricing charts on all Amazon detail pages once its downloaded and enabled. Please see the screenshot below for the Keepa extension page:
Now that we have walked through the core features of Keepa, you can understand why this product is one of the most important tools in the Amazon business as it informs much of our research, buying, and pricing decisions.
The Reseller’s Guide to Keepa
Hopefully this post will help you get started with Keepa – but we’ve just scratched the surface in terms of what you can do with historical sales data. Stephen Smotherman from Full-Time FBA has an entire video course on Keepa and the things you can do with the data. It’s called The Reseller’s Guide to Keepa, and has over 34 videos that are focused on helping you make the best possible sourcing decisions.
You can learn more about the Reseller’s Guide to Keepa here.
Please leave any comments or questions you have about this post in the section below! Happy selling!
Is there an API or algorithm you use to track prices for so long? How can I get access to it?
Hi Esha,
Keepa has an API you can get access to if you sign up for their paid plan. That may help. If that doesn’t answer your question please let me know a few more details and I’ll try to help.
Best Regards,
Ryan
Hello Ryan,
Thank you for this information.
How do you buy an item one finds in new product find?
Especially by using online arbitrage.
Thank you
Angel
Hi Dark,
Thanks for your comment.
I’d recommend checking out our free blog post guide online arbitrage.
Hope that helps!
Best Regards,
Ryan
Hi Ryan,
Thank you so much for this explanation.
So once you found products to sell how do you buy them? How do you know where to source them from?
Thank you
Angel
Thanks for your comment. Here are a couple free blog posts that should help.
Guide on Retail Arbitrage
Guide on Online Arbitrage
Best Regards,
Ryan
Great post! Thanks for explaining not only how to read the graph but also how you use the info and also for covering the Data section. Do you use the Deals tab?
Thanks for the comment Jill!
At this time the deals tab isn’t something that we use often.
Best Regards,
Ryan