The month of April is in the books, and that means it is time to share the results of my Shopify store experiment for last month.
It was a great month, and we set a few new records. Let’s jump right in and take a look at how the month turned out.
If this is your first time reading one of the posts about this experiment, you can catch up on the past ones HERE. On a monthly basis I share exactly how this website that I purchased is performing. Throughout the process I will include things that are working, things that aren’t, and share my progress with you.
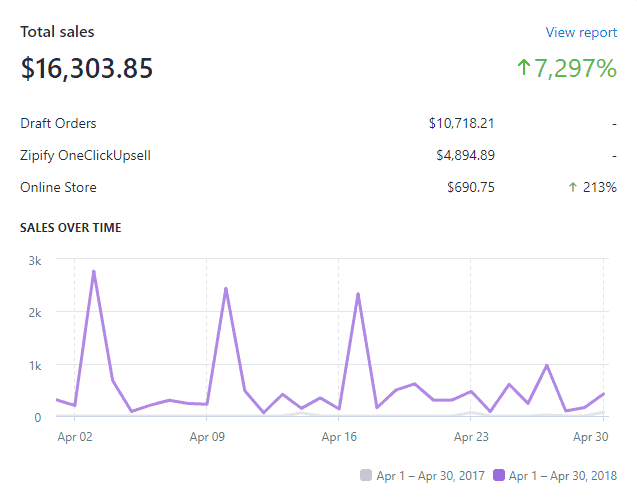
Total Sales for April 2018 vs April 2017:
April was the best month of sales so far for the lifetime of the site at just over $16,000 in sales.
Taking a look at this screenshot is a good reminder that consistent effort over a period of time can really pay some big dividends. Even if sales for the last quarter or the last month didn’t go as planned, it’s possible to turn things around quickly. As you can see sales are up over 7,000% compared to the same time period last year. This took putting a strategic plan in place, and consistent action by my team.
I owned this website in April of 2017, but wasn’t taking it as seriously then. My team and I started putting in real effort in December of 2017, and as you can see sales are up a huge amount this month compared to one year ago.
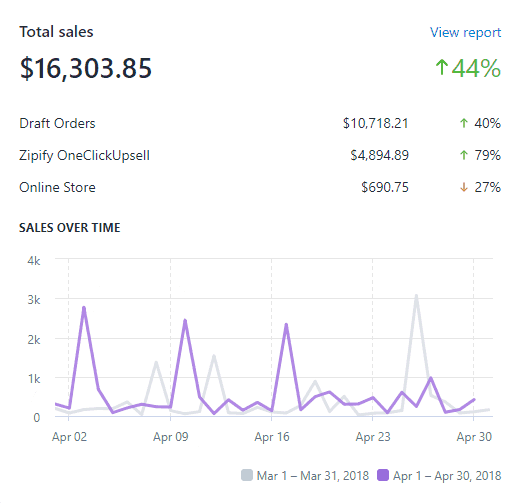
Total Sales for April 2018 compared to March 2018:
This screenshot shows the breakdown compared to the month of March.
Draft orders are “wholesale orders” where we are selling to other retailers carrying our products. Zipify One ClickUpsell and Online Store orders were purchases made by customers on the website.
It was great to see both the wholesale orders, and the purchases directly through the site growing in the month of April. During the month of April we were able to add 11 new wholesale partners, and our products are now in about 20 stores around the United States. We’re starting to see re-orders from some of our wholesale partners, and hope to see that trend continue.
To elaborate a bit further on the orders directly from our store. In the screenshot above, Zipify OneClickUpsell is a tool we are using to offer customers a special offer if they add another item to a purchase. So of the $4,894 shown above, only a portion of this revenue is actually from an upsell.
To be specific, there were 25 orders during the month had a customer purchase the upsell offer. This added $500 in revenue, and added over $300 in gross margin. As we continue to get more and more orders on the site the upsells should have a very material impact to our overall profitability.
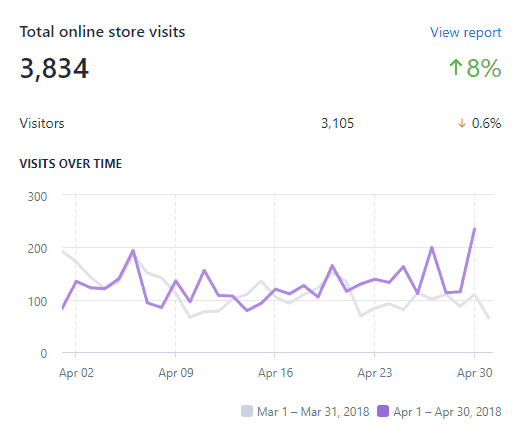
Next up is a breakdown of total online store visits compared to last month:
We saw an increase in online store visits by 8% compared to last month. There was a slight drop in unique visitors, but I’m happy to see this number stay consistent across the month in comparison to a drop at the end of March.
Here is what my online store visits by month (sessions) look like from April 2017 – April 2018:
As you can tell, based on last year, my website sees the highest traffic between May – August.
We are seeing between 3,000 – 4,000 sessions per month these past couple of months and I hope to see them increase to the 7,000 – 8,000 sessions per month during June, July, and August. These are the peak months for some of my products and it’s crucial to invest in appropriate marketing during this time frame to take advantage of the increased traffic.
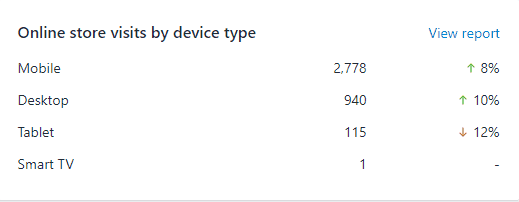
Here are the online store visits by device type for the month of April:
I included this on last month’s post to share how important mobile is for us. It continues to increase for both mobile and desktop, and was interesting to see there was one visitor from a Smart TV.
Conversion rate:
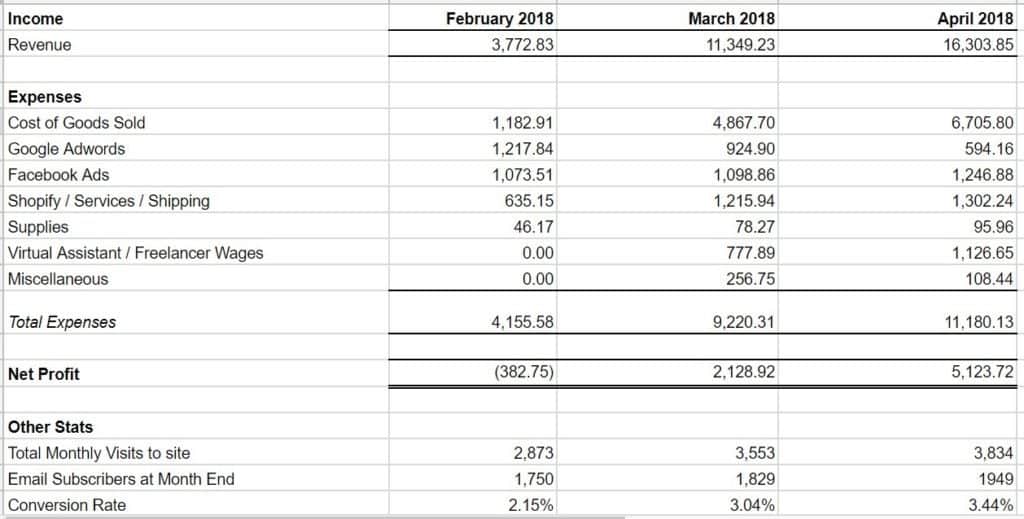
Last month we were seeing a conversion rate of 3.04% for the month of March. For the month of April, our conversion rate was 3.44%, which is great increase. I believe one reason we were able to increase .4% this month was a few promotions that we ran during the month. The lower priced limited time sales that we ran led to a higher conversion rate while the sales were active, and increased the overall percentage for the month.
Income Statement for April 2018:
As you can see April was a huge step in the right direction in terms of the profit the site is generating. I will go into more detail below on some things that went well and helped contribute to this during the month.
Here’s a look at a screenshot of the 3 Facebook Ad campaigns I was running during April for this project:
The main columns that I pay attention to are the cost per result and the website purchase return on ad spend. As I mentioned in my previous post here, any conversion below $25 is profitable. For the month of April I saw an average cost per purchase of $20.02 on the main campaign, and about $5 per conversion on 2 retargeting campaigns. This means my Facebook ads were profitable last month and this is only accounting for the initial sale. This does not include the potential of these customers to order again in the future. The goal is always to lower the cost per result to increase profitability but I am happy to see I’m making money off Facebook Ads.
When it comes to Google Adwords, we haven’t seen quite as great of results there. It’s actually been poor. We cut the spending pretty significantly compared to the prior month. There are a few adwords campaigns that will continue, but most of the current campaigns that are running will continue to be phased out as they aren’t generating profits at this time.
Now onto some notes related to the income statement shown above, and some noteworthy updates for April.
An important note is that this income statement doesn’t include the wages for the main individual that is working on this project. The main reason for this is that this team member is working on some other projects in the business too. So with their wages factored in this would add to the expenses shown above. On the flip side, I could have put in all of the time myself for this project, so it depends a bit on how you look at it. The way the numbers are presented are as if the owner of the site is doing most of the work.
The main services that are being used that make up the expenses shown are: Shopify for running the site, Zipify OneClick Upsell for upsells, Woodpecker for sending emails to wholesale prospects, Onlinejobs.ph for hiring virtual assistants, and Freeeup for wages for a designer for a few miscellaneous tasks.
April was a great month overall, especially when it came to the profitability of the project being over $5,000. Especially when one of the goals of this project is to potentially sell it. If, and that’s a big if at this point, the site is able to maintain a profit of $5,000 per month for around 12 months it would likely sell for $120,000 to $150,000.
Our goal is to continue to grow the site, and not level off at $5,000, but you can see that a very nice pay day can be created by selling something that makes on average $5,000 per month. It would also be a very nice income stream, so it’s far from guaranteed that I will choose to sell. It’s definitely too early to tell, and as I mentioned in one of the first results posts this year, I don’t plan on making that decision until the end of August.
This was the first month where we had 4 virtual assistants doing outreach for the full month. It led to 11 new wholesale clients, and we have several more in the pipeline. Finding existing retailers to purchase our products wholesale has been great, and we’ll be continuing to work this aspect of the business.
The sales increase compared to April was great to see, and the fact that the adspend decreased this month is even better.
Conclusion:
Overall April was another big step in the right direction. The increase in sales and profits were great, and we have some good momentum that we’re going to look to continue. We’ll close up with a few goals for next month:
- Over $20,000 in sales and $7,000 in profit
- Get a trademark in place
- Get approval from Amazon for another seller account for this project
- List the products for sale on eBay
- Begin testing out influencer marketing
- Redesign the website to help optimize for conversions
- Maintain profitable Facebook Ad campaigns
- Get Google Adwords turning a profit
- Add 10+ new wholesale clients
That’s a wrap on this month’s financial results post.
If you have any questions or want additional information included for next month’s post, leave a comment below – and please share this using the social links on the left side of the page if you know someone else who would appreciate it!
Additional reading:
How to Make Money Online: 9 Scalable Ideas Worth Your Time in 2018



Thanks for this very insightful post Ryan. Am happy to have heard your interview from Mixergy.
Hi Ryan,
You are welcome, and very cool to hear that you enjoyed the Mixergy interview!
Best Regards,
Ryan
Thank you for the detailed overview – it’s great motivation for me to get back into focusing on my website sales and marketing again! Lisa C.
You are welcome Lisa, glad to hear it provided some motivation!
Best Regards,
Ryan
Thanks for posting these results Ryan. They are super insightful and interesting!
Thanks John!
How do you select your new wholesale customers and what is the product on the site that is offered?
Hi Michael,
To find retailers that are interested in purchasing our products wholesale we are using a few outreach strategies. I discussed a bit in last month’s post, but the short version is that we are targeting brick and mortar stores who carry either similar products, or products that are complementary to the ones we sell. We then email these prospects to see about the possibility of them purchasing from us.
I’m not able to share the exact products the site carries at this time to keep the site confidential. I want this to be a case study that shows growing the site without any links to it from this website or any other that I am associated with.
Best Regards,
Ryan