When you send an item to FBA warehouses, do you know how long it takes for that item to actually sell? Do you know if the profit on the item when it sells is higher or lower than your projected profit when you sent it to FBA warehouses?
Today’s post will go over a way to evaluate the performance of items you have sent to FBA when using InventoryLab, and allow you to definitively answer those questions. This post walks through a step by step process to check the performance of any closed batch to help you evaluate how well your business is actually doing. This post also contains a free download of the spreadsheet that makes this analysis quite simple.
Today’s post is a guest post from Kim Coghlan. I had a spreadsheet that did a similar analysis, but Kim’s was admittedly better. I saw her share it on Facebook, and reached out to see if she would be willing to share her process in a guest post. Luckily Kim was willing to share the details.
Take it away Kim:
As an InventoryLab user and fan, I am in love with reports. I really see value in being able to pull up a Profit & Loss statement for various time periods, see Profitability by Supplier, Category, or SKU at a glance, and watch the profit, ROI, and margin on individual sales.
InventoryLab does many things extremely well and they’re always adding new features, but there is one feature in particular I am waiting for. I want to be able to see how an individual batch is doing. For example, that trunk load of clearance I bought at Walmart and listed months ago, or all those shoes I bought online last month and sent directly to a prep center, or my first-ever foray into a new category. I want to be able to analyze the sales, profits and sell-through rate of a specific batch after a reasonable amount of time, and I want to do it without painfully searching SKU by SKU.
I realized recently that I might be able to pull the necessary information myself and put it into a spreadsheet that calculated those results for me. I’m far from expert level in Excel, but I enjoy playing with it and learning how to make it do new and useful things. I sat down at my computer to see what I could build, and here is the result. It’s not pretty or fancy but it does exactly what I want it to do, and I really like that all the necessary info can be taken quickly and easily from InventoryLab – no need to log into Seller Central at all.
The Excel workbook
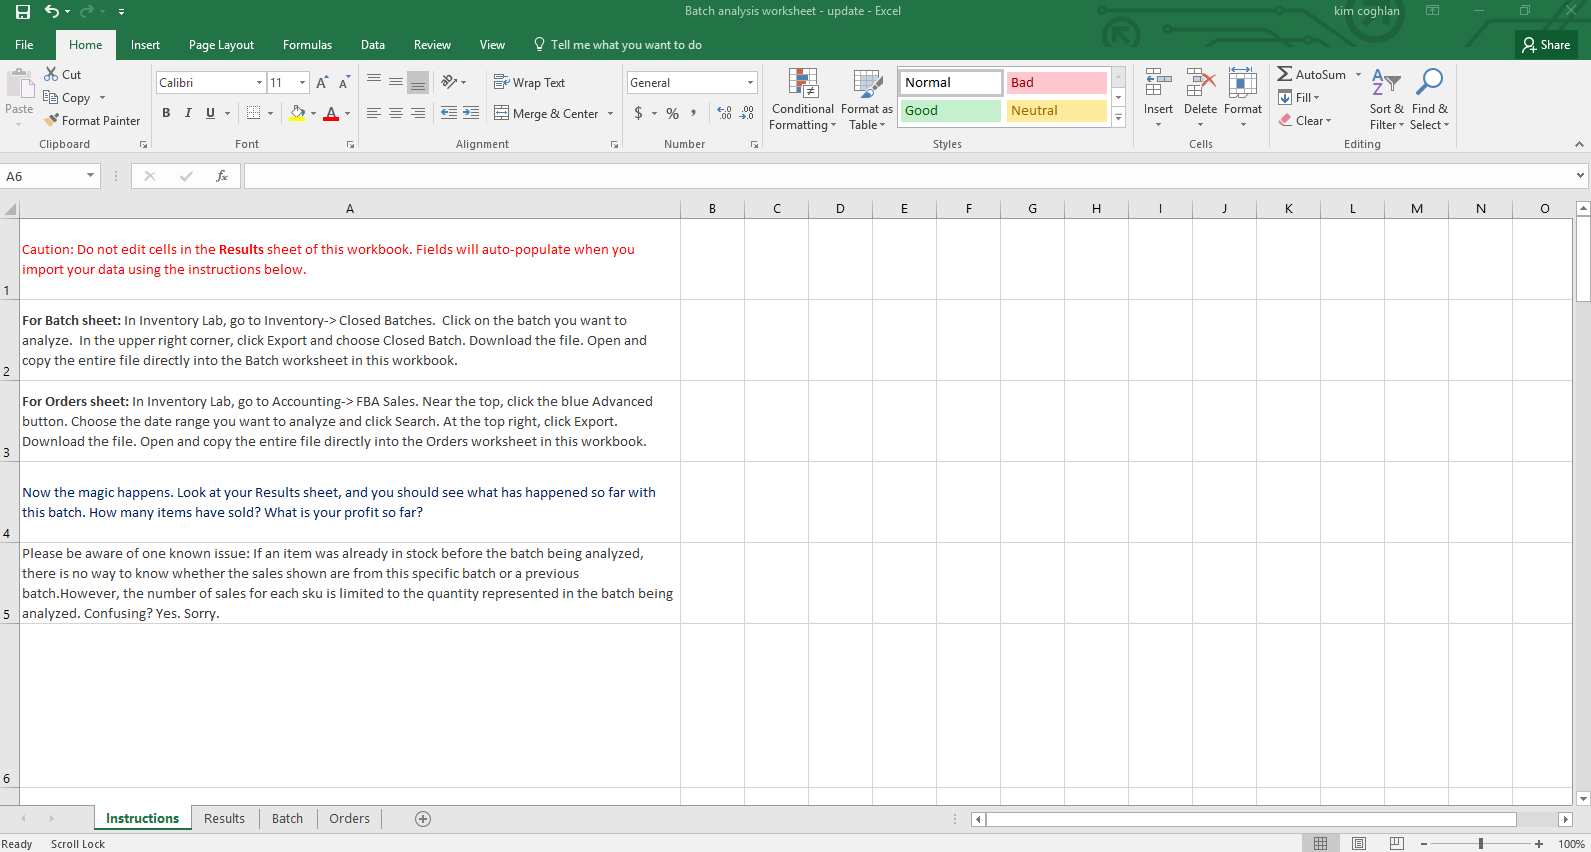
This is actually an Excel workbook with 4 sheets. The first sheet is very simple instructions for use. It gives you step by step instructions to pull the two reports you need directly from InventoryLab.
For Batch sheet: In InventoryLab, go to Inventory -> Closed Batches. Click on the batch you want to analyze. In the upper right corner, click Export and choose Closed Batch. Download the file. Open and copy the entire file directly into the Batch worksheet in this workbook.
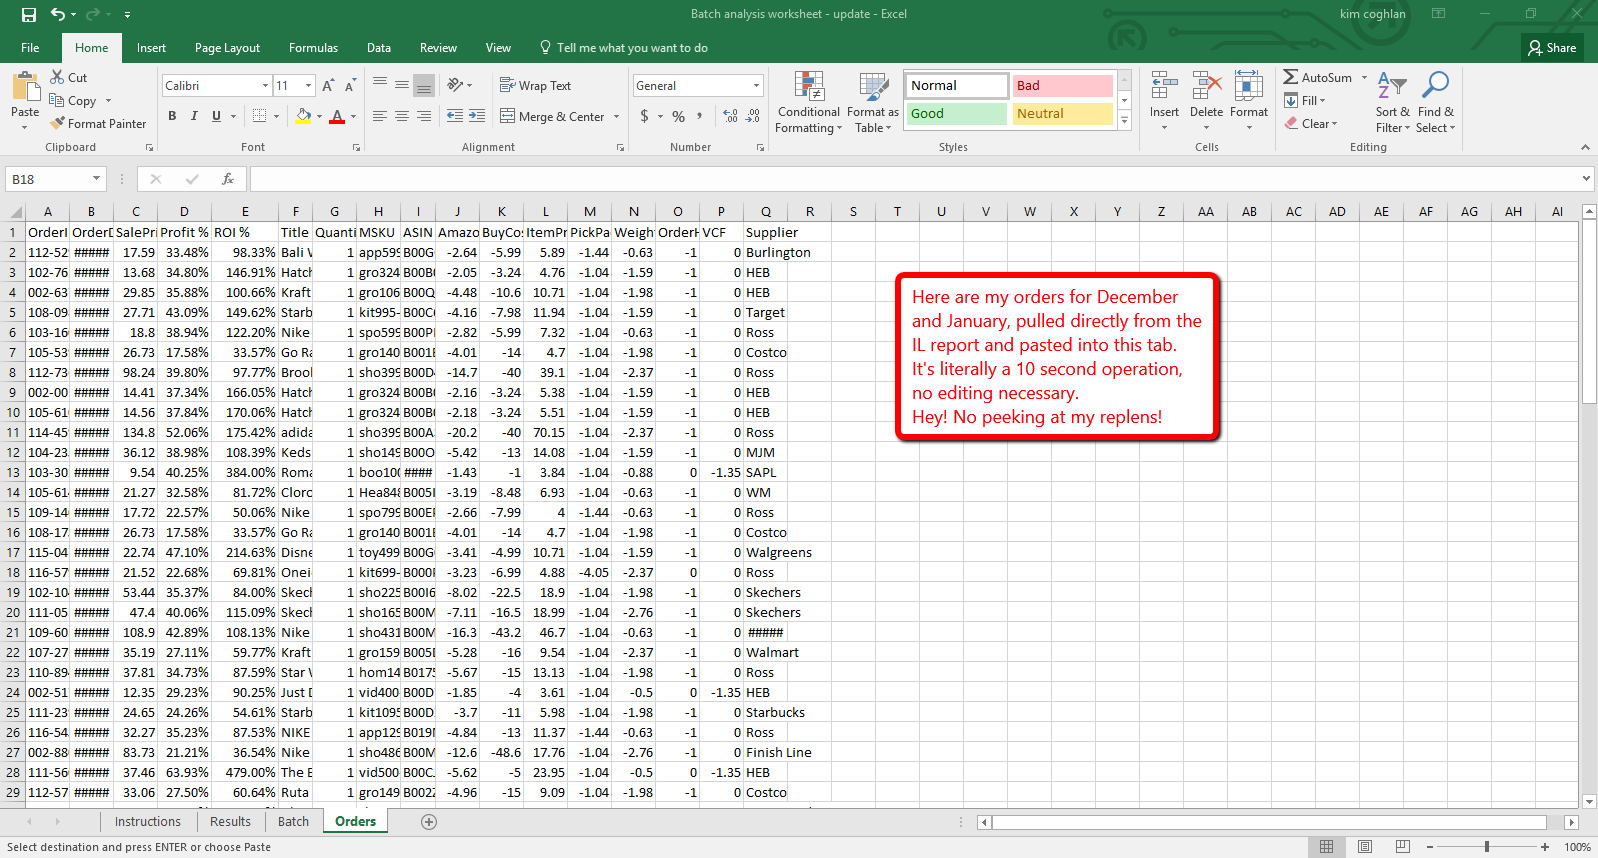
For Orders sheet: In InventoryLab, go to Accounting-> FBA Sales. Near the top, click the blue Advanced button. Choose the date range you want to analyze and click Search. At the top right, click Export. Download the file. Open and copy the entire file directly into the Orders worksheet in this workbook.
Note on all screenshots in this post: You may want to click to enlarge so you can see all of the details. Alternatively, here is link to an imgur album with all of the images (in order) that you can very easily zoom in on to see all of the details. Click HERE to view the album.
Here is the instructions sheet:
The second sheet is where you will see the results. You won’t edit anything here. You’ll just see the good news.
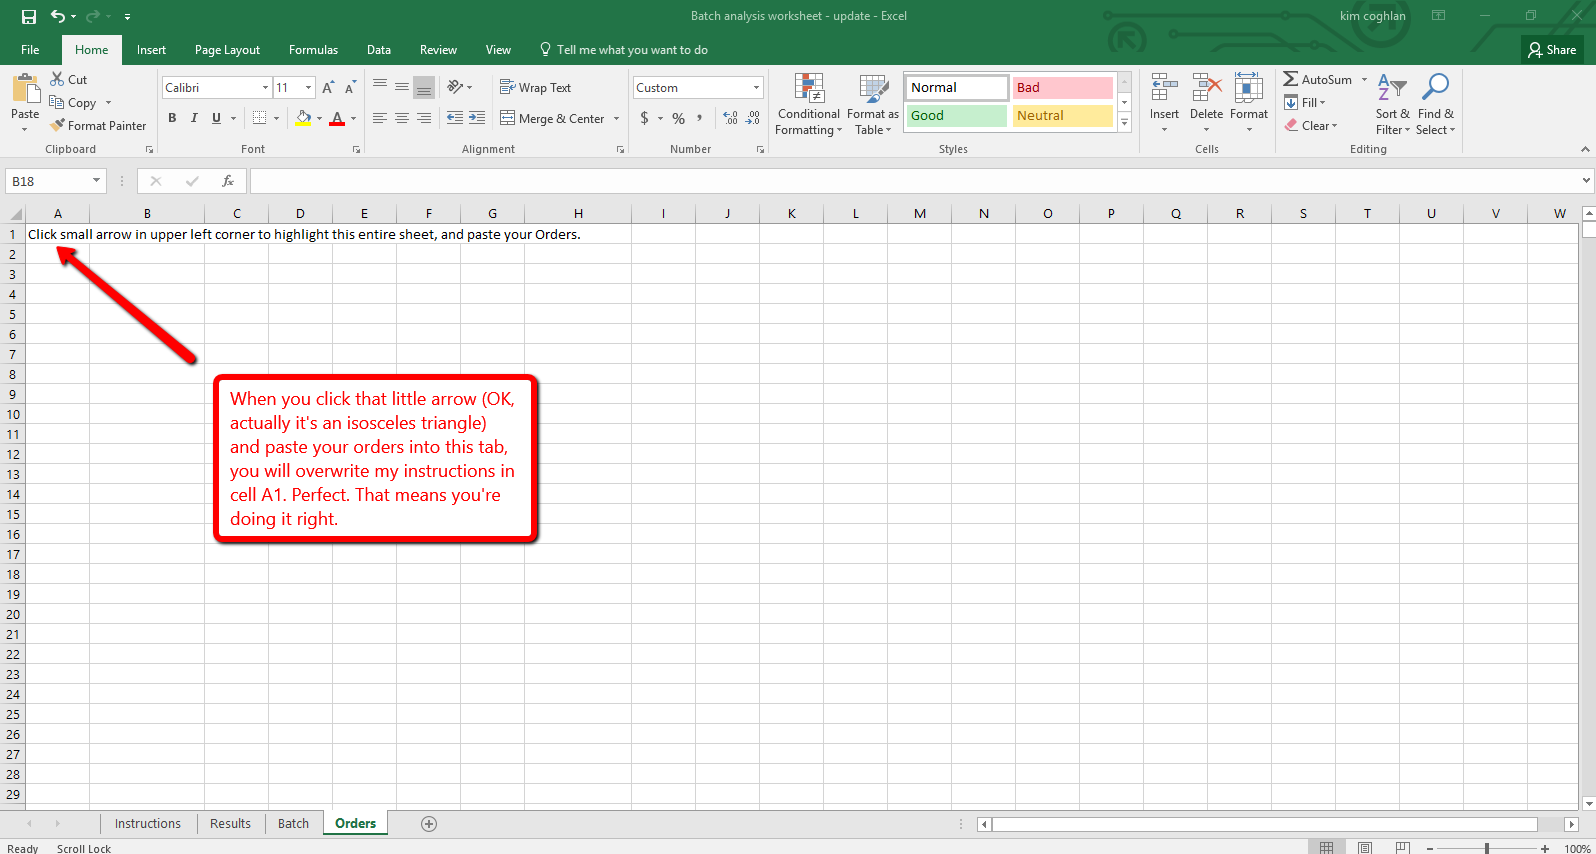
The third and fourth sheets are where you paste the two reports you pulled. No editing necessary, just a full and simple copy/paste. It’s really that easy.
If you want to analyze multiple batches over the same time period, just leave the Orders sheet alone and paste new batch info into the Batch sheet. You can analyze as many batches as you want in just a few seconds per batch.
Similarly, if you want to see how a batch has performed over time, you can leave the Batch sheet alone and paste the orders from a different time period into the Order sheet.
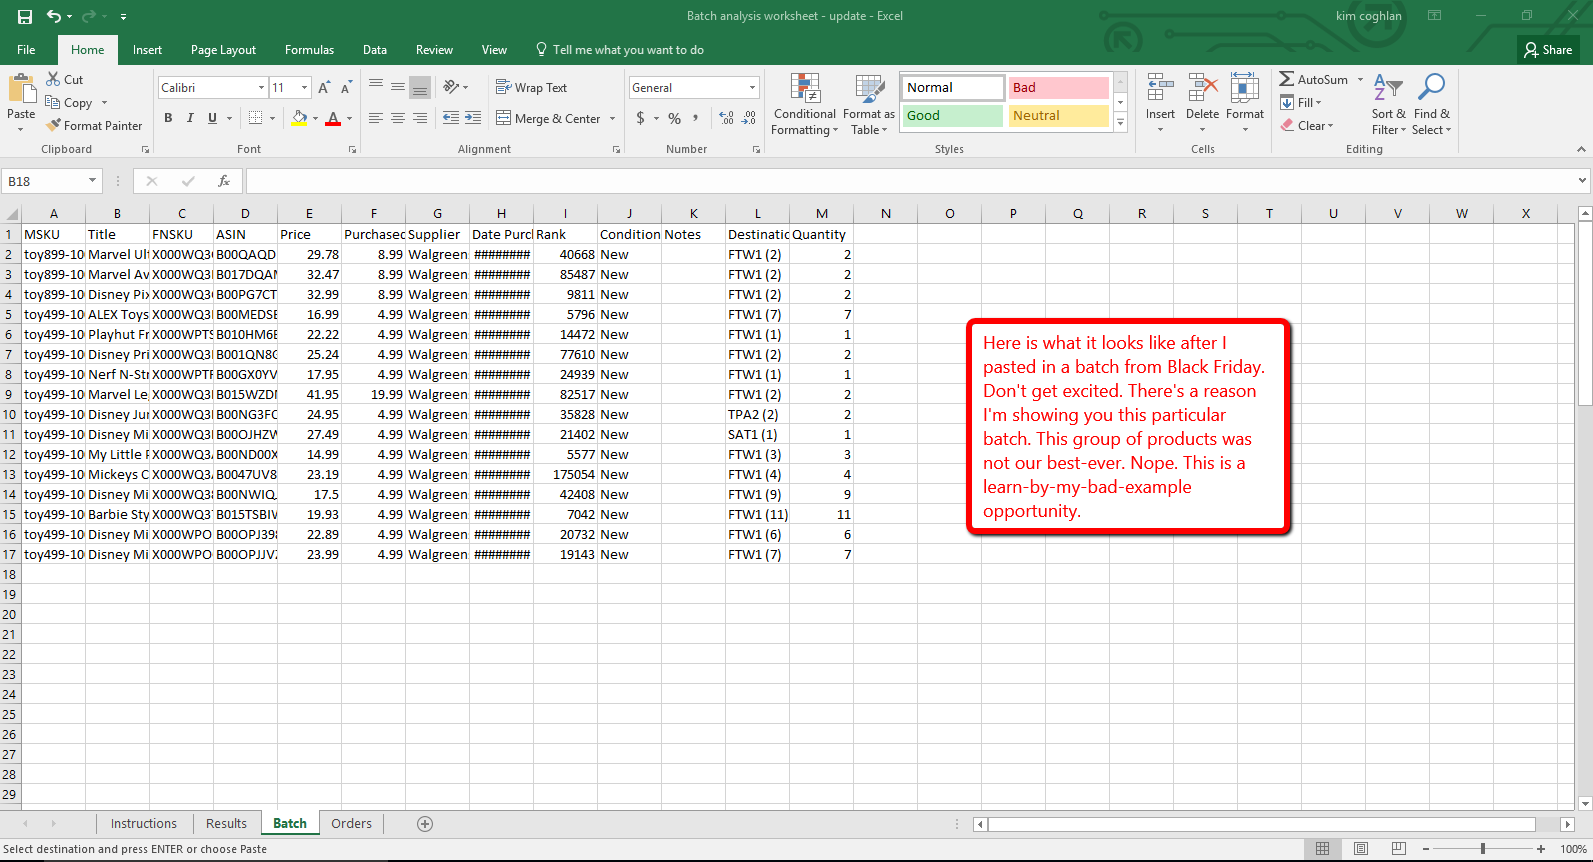
Want to see it in action? Here’s a sample batch – a bad one. This was some Black Friday purchases. I could pretend to do it purely in the interest of transparency, but really it’s because I don’t want to reveal all my best moneymakers. Oh, and also transparency. You might learn something from my mistakes. Learning from the mistakes of others is my favorite way. It’s a lot more fun than learning from your own mistakes.
And here I pasted in the orders for Dec/Jan. So far, so good. December and January were our two best months ever. We had tons of orders. This should be great!
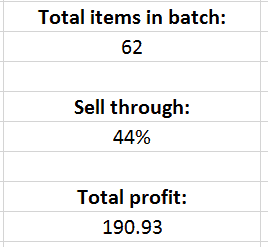
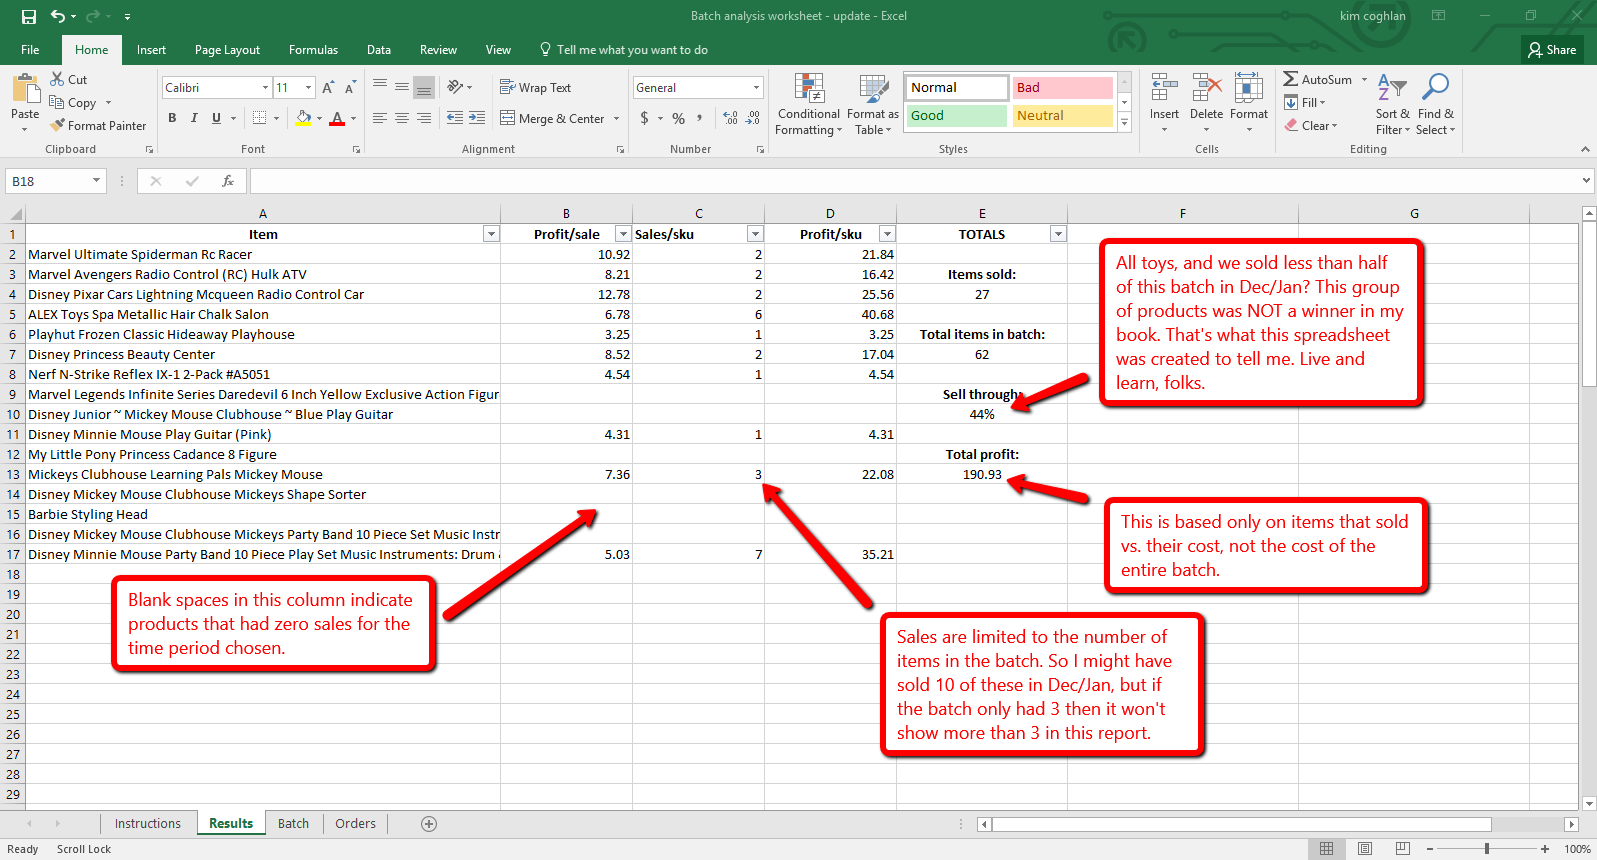
But guess what? When I click over to the results tab, I don’t like what I see at all.
Less than half of these products sold in the 2 months after I listed them. This is bad news, but this is why I created the spreadsheet. I need to know these things. It’s one thing to see a comprehensive list of slow-moving inventory, but now I can narrow down where and when that inventory came from on a batch-by-batch level. Next Q4 we’ll know where and when we found the winners vs. the losers.
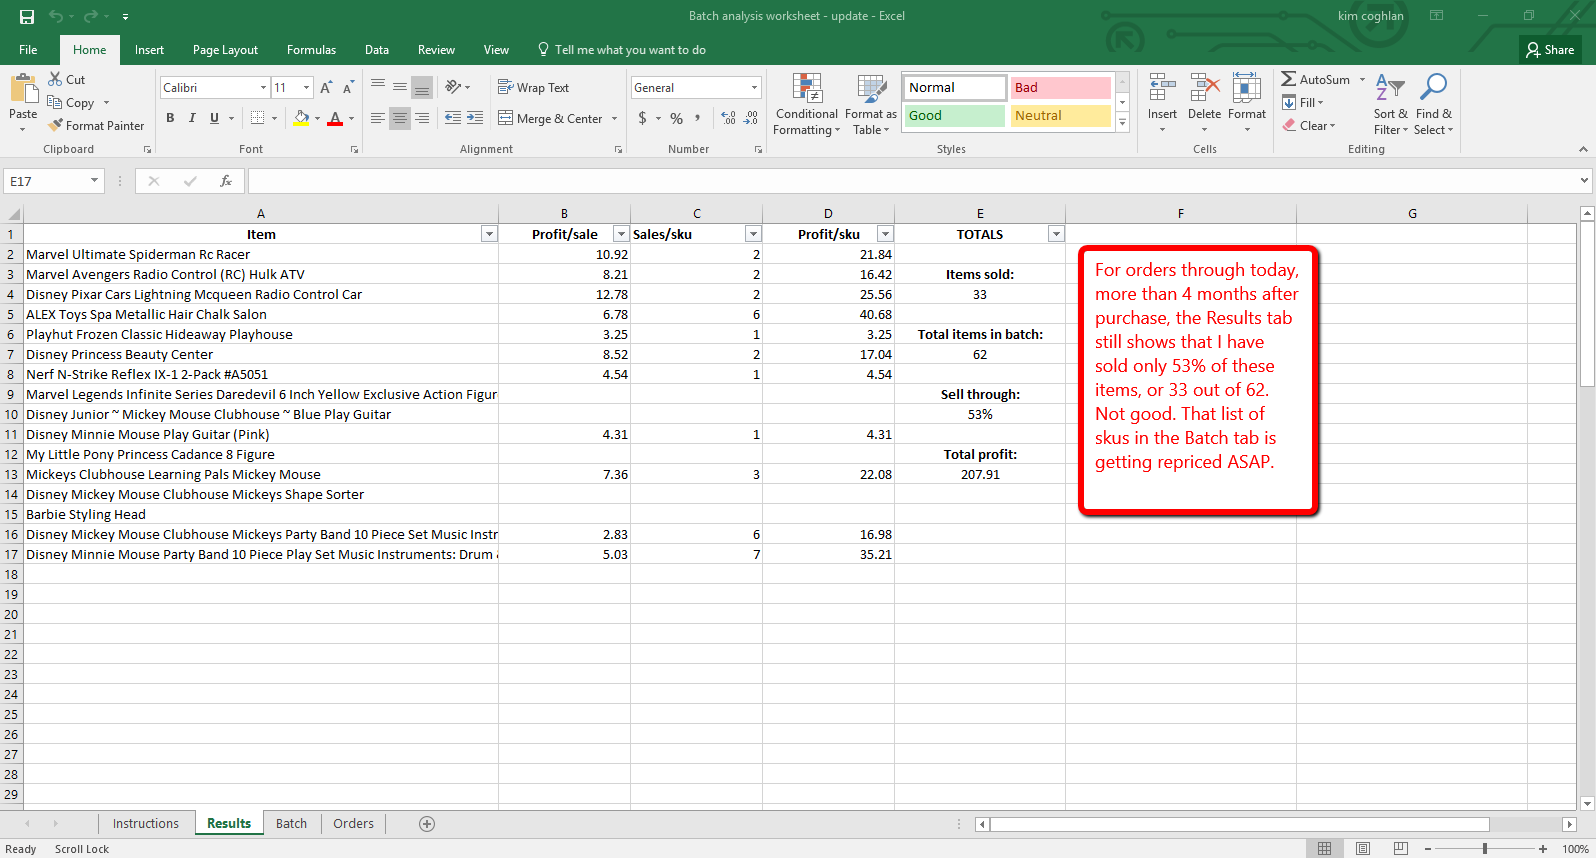
I have seen a few of these items move recently so I changed the dates in InventoryLab and exported a new list of orders reaching all the way through today. I was hoping for good news, but the results didn’t change much. Four months after Black Friday, I’m still waiting for nearly half of the items in that ill-fated batch to sell. That list of SKUs in the Batch tab will get copied directly into my repricer and minimum prices are going DOWN.
I had fun creating this spreadsheet, and I love having this information available. Even bad news can be good news if it helps you take positive action. We should see a welcome bump in sales when this old inventory starts moving, and it will free up capital for us to make new and better purchases.
I’m eager to share this spreadsheet with other InventoryLab users and am looking forward to your input if you try it out!

Thank you to Kim for putting this post together, and making the spreadsheet available for free! If you have any questions or comments, please leave them below.



Awesome tool. Nicely done. Thanks for sharing guys!!
Great to hear you like it Tommy!
Best Regards,
Ryan