The months of June and July are now in the books, and that means it’s time to share the results of my Shopify store experiment for the last couple of months. Normally I aim to share these posts every month, but was a bit behind, so this month is going to take a look at the months of June and July.
If this is your first time reading one of the posts about this experiment, you can catch up on the past ones HERE. The short version is that I purchased a website that was doing very little in sales, and I’m trying to turn it around. On a monthly basis, I share exactly how this website is performing. Throughout the process I will include things that are working, things that aren’t, and share my progress with you.
We’ll begin by taking a look at sales for June and July of this year compared to 2017.
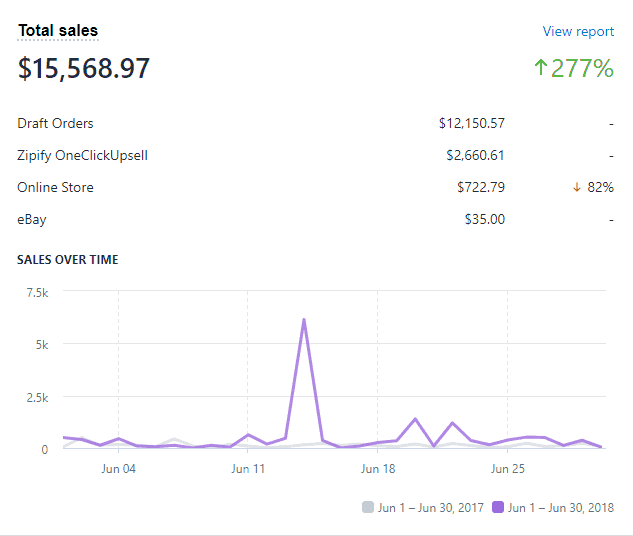
June of 2018 sales compared to June of 2017:
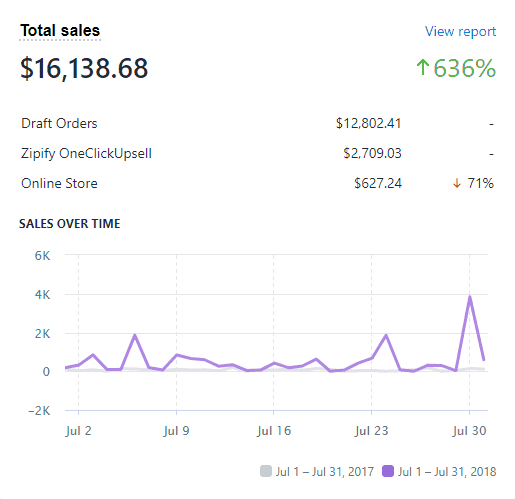
Next up, here’s the sales for July of 2018 versus July of 2017:
For clarity on the screenshots, draft orders are “wholesale orders” where we are selling to other retailers carrying our products. Zipify One ClickUpsell and Online Store orders were purchases made by customers directly on the website.
While the sales for these months were less than what we saw in the May results, I’m very happy with the year over year growth. The project is definitely trending in the right direction. Around the end of May or beginning of June, I made the decision to focus the business almost exclusively on the wholesale portion of this project. This is where we are working to find existing retailers to carry and sell our products.
As you can see from the sales screenshots above this has been where a lot of our results thus far have come from. I still think that getting more orders to our online store is viable, and a big opportunity, but we are able to make significantly more profit per order via wholesale. That’s not even factoring in that many of our wholesale partners have reordered from us multiple times, further increasing the potential of focusing on wholesale for the near future.
Next up, we’ll look at the traffic to the site.
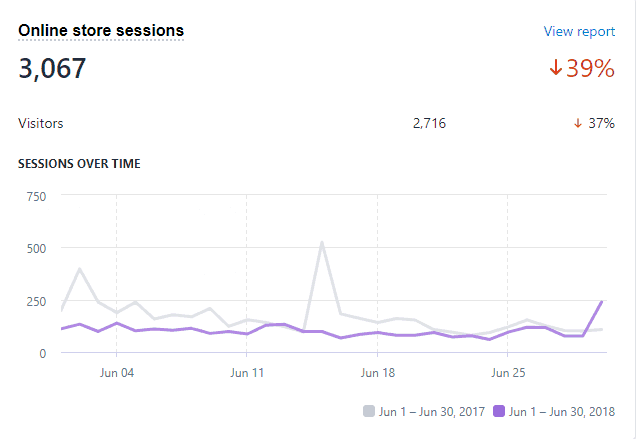
Total Online Store Visits for June 2018:
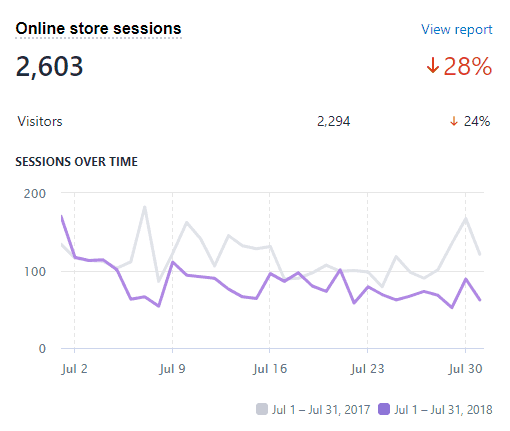
Total Online Store Visits for July 2018:
As you can see, both of these are lower than they were in the prior year. This is largely due to focusing primarily on finding wholesale partners for the present time. Due to this change in focus, I’m not concerned with the decrease in traffic to the store. Especially since overall sales are up dramatically from these same time periods in 2017.
To be clear I still think that driving traffic to the website is an opportunity. It’s just not as big of an opportunity as pursuing the wholesale side of the business first.
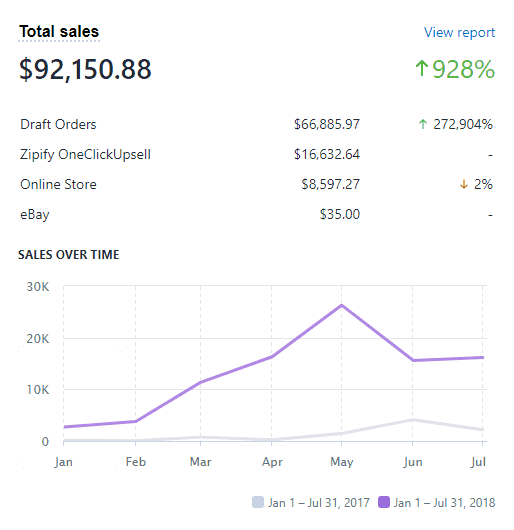
Also, here’s a look at the total sales for the year thus far. This screenshot shows sales from January 1, 2018 to July 31, 2018.
YTD Sales:
Sitting at a little over $92K in sales for the year feels pretty good. Especially when that’s over a 900% increase compared to the same time period 1 year ago. Sometimes when there’s a big spike in sales like there was in May, it can feel like a disappointment if you don’t beat that new high. I don’t feel like that too much in this case, although I would have loved to beat May’s sales, but zooming out and looking at the progress on an annual basis is a great reminder of how things are progressing.
Online Store Conversion Rate:
In terms of conversion rate, for June we saw 2.93%, and for July we saw 3.42%. These are down a bit from prior months. This is also due to focusing more on the wholesale side of the business. We now have wholesale prospects that visit our website, and aren’t looking to purchase anything, so this drives down conversion rate a bit as well. Ultimately these decreases are to be expected due to this change in focusing primarily on wholesale for the time being.
Facebook & Google Ads:
Facebook ads for June and July 2018 don’t have too much to note as compared to prior months. Retargeting ads performed well and had a very profitable cost per conversion. Most of the other campaigns on Facebook were running at about break even on the initial sale. As a result I paused most of the Facebook ads we had running outside of the retargeting ads. You’ll see this show up below in the income statement for July. I will be revisiting some Facebook ad strategies in the future. For now we’ll continue focusing on the wholesale side of the business, and see what we can do to grow that.
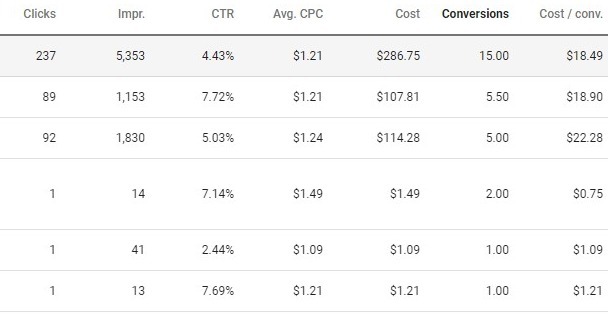
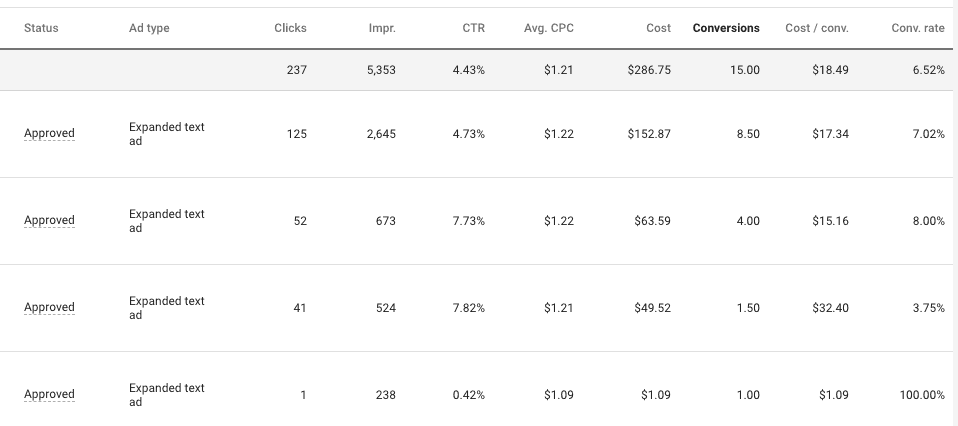
When it comes to Google Ads, we actually have several that are performing quite well. Here’s a look at a screenshot of the results from June 1 to July 31 of some of the ads running there:
The last column is the main one to pay attention to. It’s the cost for getting someone to purchase. As I’ve discussed in prior posts we need a cost per conversion below about $25 to make a profit on the sale. As a result all of the campaigns in the above screenshot are profitable, and some of them are extremely profitable, although on a relatively small number of conversions. We’ll be continuing to make tweaks to these ads, and others that aren’t performing quite as well to work to continue to improve our cost per conversion.
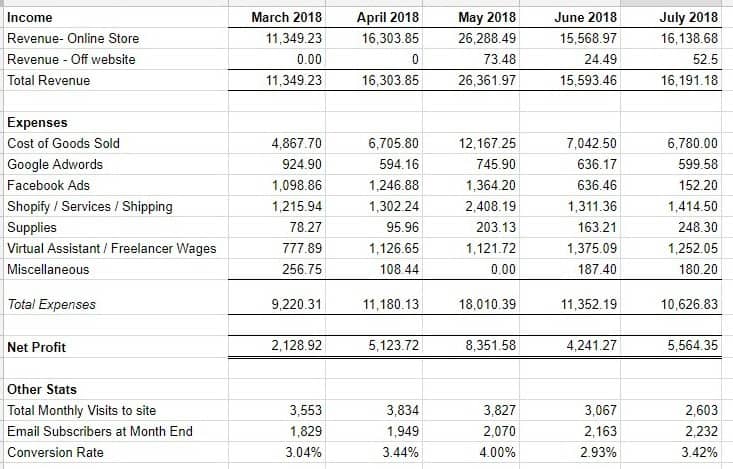
Income Statement for June and July 2018:
Overall profits were just under $10K for the months of June and July combined.
While I would have liked to see the growth from the prior months continue, I am satisfied with where things are at. Especially when compared to where the site was at the same time last year, things have really come a long way.
The average profit per month over the past 5 months is just over $5,000. This should lead to a very nice valuation if I do end up selling this project. If the site sells for 24 times it’s monthly earnings this would lead to a sales price around $120,000. 24 times monthly earnings is a relatively conservative valuation, so I do think more is possible. We’ll see how things trend over the next few months, as that will definitely affect the valuation too.
An important note is that this income statement is presented as if the site is being run by an owner operator. It doesn’t include the wages for the main individual that is working on this project. The main reason for this is that this team member is working on some other projects in the business too. So, with their wages factored in, this would add to the expenses shown above. On the flip side, I could have put in all of the time myself for this project, so it depends a bit on how you look at it. The way the numbers are presented are as if the owner of the site is doing most of the work.
You might notice the additional line item in this chart for “Revenue – Off Website.” This is from a retail store that we are working with who sells our products on consignment. They take a fee for selling the product and send us our portion via check. This wasn’t a huge amount this month, but I do think it has the potential to grow in the coming months.
On the expense side of things, the main services that are being used that make up the expenses shown are: Shopify for running the online store, Zipify OneClick Upsell for upsells, Woodpecker for sending emails to wholesale prospects, Onlinejobs.ph for hiring virtual assistants, and Freeeup for wages for a designer for a few miscellaneous tasks.
Conclusion
Overall in the months of June and July some good progress was made. The growth of the site is way up compared to one year ago, and there’s a lot of ways that I see we can continue to grow the business.
Current challenges with the project:
- Forecasting inventory. We’re stocked up with more supply than we currently need on some of our styles. This is partially due to the spike in sales we saw in May and we made some aggressive forecasts based on this.
- Dialing in Facebook Ads outside of retargeting ads.
- Sales are down as compared to May of this year.
What’s going well:
- Retargeting Ads.
- Selling to existing retailers.
- Utilizing virtual assistants to find potential retailers to sell to.
- The valuation of the site based on average monthly profit is trending in the right direction.
- We have some profitable Google Adwords campaigns running.
- We had our first couple of sales come through on eBay after getting setup there.
Goals for near future:
- Continue to focus on adding wholesale partners.
- Support several wholesale partners of ours who will be selling our products at a few local events. This is another potential growth opportunity for us, and one that we can tap into through working with wholesale partners.
- Determine new product packaging. We have several samples of new packaging, and will be making a decision on this in the coming weeks.
- Launch products on Amazon.
That’s all for this recap. Let know if you have questions in the comments below!


Great series. Are you holding your inventory in your warehouse and then fulfilling the order yourself, or have you outsourced all of that (since you are currently not using Amazon FBA for this project)
Hi Biel,
Glad you’re enjoying the series! Right now I’m holding the inventory in my warehouse and one of my team members ships the orders.
Best Regards,
Ryan
is there any tips on setting up google adwords campaigns? how do you target customers with your campaigns(nationwide? certain cities only?)
adwords seems like a good tool to get potential customers but seems like if used in the incorrect way it will result in a loss of money
Thanks for the comment. I’ll consider doing a full post on Google Adwords at some point to share more about the strategies we’ve been using there.
Best Regards,
Ryan